
An electricity bill tells you how much energy a factory bought. It does not tell you which line used it, whether the machines were producing, or how much of that energy went into scrap, rework, warm-up, idle time or simply leaving auxiliaries running.
That distinction matters more in 2026. In Malaysia, the Energy Efficiency and Conservation Act 2024 is already in force, and the Energy Commission states that consumers at or above 21,600 GJ over 12 consecutive months can be required to appoint a Registered Energy Manager, implement an energy management system, submit annual reports and conduct periodic energy audits. The Commission also notes that notices under the new regime could start from January 2026 onwards. In Peninsular Malaysia, the RP4 electricity pricing framework runs from 1 July 2025 to the end of 2027, with revised tariff structures and peak/off-peak arrangements.
Singapore has a different cost structure, but the direction is similar. The carbon tax is S$45/tCO2e for 2026 and 2027 for taxable facilities, while the Energy Efficiency Grant continues to support qualifying efficiency investments. For eligible manufacturing projects, the Advanced tier can support larger equipment investments, subject to its conditions and demonstrated energy savings.
So I would not stop at another plant-wide energy dashboard. The useful step is to connect electrical data to what the factory was actually doing at the time.
kWh per good unit is usually more revealing than kWh alone
A factory can reduce total monthly electricity consumption simply because production fell. That is not necessarily an efficiency improvement. Likewise, output can rise while energy intensity improves, even though the electricity bill is higher.
For most discrete manufacturing lines, I like to see at least these numbers together:
| Metric | What it tells you |
|---|---|
| kWh per good unit | Energy intensity after scrap is excluded from useful output |
| kWh per batch / recipe | Whether some products or process settings are inherently more energy intensive |
| Idle kW | How much power a machine or line draws while not producing |
| Energy during planned downtime | Whether heaters, pumps, conveyors, extraction, HVAC or other auxiliaries remain unnecessarily energised |
| kWh per scrap or reworked unit | The energy penalty associated with quality loss |
| Peak demand contribution | Which loads are driving coincident site peaks |
OEE by itself does not provide this. A line can have respectable availability and performance while consuming too much energy in standby, during changeovers or while making rejects. Conversely, a lower-OEE period may still be energy efficient if the line is intentionally slowed for a low-rate product. Energy and OEE should be analysed together, but they are not the same KPI.
Meter where the operational decisions are made
Submetering every small motor rarely makes commercial sense. Metering only the main incomer is equally limiting. The useful boundary is usually where a supervisor, maintenance engineer or control system can actually change something.
Typical points are:
- main incoming supply and major distribution boards;
- production lines or cells;
- large compressors, chillers, ovens, furnaces, pumps and extraction systems;
- high-load machine groups;
- utilities serving multiple lines where allocation is otherwise guesswork; and
- new equipment where energy should be treated as part of FAT/SAT acceptance rather than an afterthought.
Most industrial power meters already expose kW, kWh, current, voltage, power factor and sometimes harmonics over Modbus RTU, Modbus TCP or Ethernet-based protocols. If the cable already works, use the cable. There is no engineering benefit in making a simple energy meter wireless just to call it IoT.
CANS’ Industrial IoT and remote monitoring work is relevant here, but the important part is not the cloud. It is getting trustworthy plant data from the electrical and control layer first.
The timestamps have to match production
This is where many energy projects become less useful than expected. The power meter may be logging correctly, the OEE system may be logging correctly, and the MES may have accurate orders — but if the clocks, batch boundaries or machine states do not line up, the analysis is wrong.
A workable architecture is usually straightforward:
- Meters and machine data collect electrical values, machine state, cycle count, good count, reject count, recipe and order information.
- PLC, gateway or edge controller normalises field protocols and applies common timestamps.
- Historian or time-series database stores the electrical and production data at a sensible rate.
- MES/OEE layer provides order, product and state context.
- Analytics calculates energy intensity, idle losses, baselines, abnormal consumption and demand contribution.
I would normally keep the hard real-time machine control independent. Energy analytics can advise or issue bounded commands, but it should not make a production line dependent on a cloud service or an AI model being available.
For brownfield plants, this is exactly the type of integration problem where middleware is useful. CANiS integration middleware is intended to move data between plant systems without forcing every PLC, database, ERP, MES and dashboard to talk directly to every other system.
Do not collect one-second data everywhere just because you can
Electrical data has different useful time scales. A fast sample is valuable for seeing compressor starts, heater cycling, drive acceleration, machine warm-up and other short events. For long-term energy intensity, one-minute or five-minute aggregates may be sufficient.
The right approach is usually to retain enough fast data near the edge for troubleshooting, then store lower-rate aggregates centrally. That reduces database load without throwing away the information needed to explain an event.
For maximum-demand control, the control horizon should match the actual tariff and utility metering rules for that site. I would not assume a generic 15-minute or 30-minute billing window without checking the contract and meter configuration.
Once the data is reliable, some actions can be automated
Energy optimisation does not always require AI. A few deterministic controls can do useful work:
- staggering large motor, chiller or oven starts after a power recovery;
- turning off extraction, pumps or conveyors during extended confirmed idle states;
- reducing standby setpoints when a line is not scheduled to run;
- sequencing large loads so they do not create unnecessary coincident peaks;
- flagging a machine whose idle kW has drifted above its normal baseline; and
- linking energy alarms to CMMS work orders when the change is likely to indicate a mechanical or process problem.
More advanced optimisation can then sit above this. For example, a forecast can estimate whether current production and utility loads are likely to push the plant into an undesirable demand region, while the PLC still enforces the safe operating limits.
The same principle applies to utilities. We recently wrote about compressed-air digital twins, where the real value comes from connecting the energy model back to operating conditions rather than treating compressed air as an isolated monthly cost.
Four data errors that can invalidate the result
Before using the numbers for management reporting or automatic control, I would check these first:
- CT ratio and polarity. A wrong current-transformer ratio can make every downstream calculation look precise but be wrong by a fixed factor.
- Phase and load mapping. Meter names such as “DB-3” are not enough if nobody knows which machines moved after the last plant modification.
- Clock synchronisation. A few minutes of timestamp error can badly distort energy-per-cycle analysis on short batches.
- Production counters. Good count, reject count, rework and order quantity must be defined consistently. Otherwise kWh per unit becomes a reporting argument instead of an engineering metric.
I also like to reconcile submeter totals against the utility meter or main incomer over a representative period. They will not match perfectly because of unmetered loads, transformer losses and different sampling boundaries, but the gap should be understood.
Malaysia and Singapore are both moving towards measured energy performance
Malaysia’s EECA makes formal energy management a compliance issue for qualifying consumers, but the same data can be used to find operational waste. CANS covered the regulatory side separately in EECA 2024: Why Malaysian Plants Need Continuous Energy Intelligence.
Singapore’s 2026 carbon tax and Energy Efficiency Grant create a different incentive. The tax mainly applies directly to large emitting facilities, but higher carbon cost and grant support both push factories towards better measurement and more defensible savings calculations.
For either country, an energy project becomes more useful when the engineering team can answer a simple set of operational questions: what was running, what was being produced, was the output good, and why did the electrical load change?
Where CANS can help
CANS works from the plant floor upward: power meters and instrumentation, PLC/SCADA integration, edge gateways, industrial databases, MES/OEE integration, analytics and bounded closed-loop optimisation. We can also integrate energy data into broader industrial digitalisation programmes rather than building a separate energy silo.
If you are looking at factory energy monitoring, submetering, OEE-linked energy analytics or automated demand control in Malaysia or Singapore, send us an enquiry or WhatsApp CANS.
References
- Suruhanjaya Tenaga, Energy Consumer — EECA 2024 obligations, accessed 19 September 2026.
- Suruhanjaya Tenaga, Transition from EMEER 2008 to EECA 2024, accessed 19 September 2026.
- Suruhanjaya Tenaga, Components of IBR — RP4, accessed 19 September 2026.
- National Environment Agency Singapore, Carbon Tax, accessed 19 September 2026.
- Enterprise Singapore, Energy Efficiency Grant, accessed 19 September 2026.
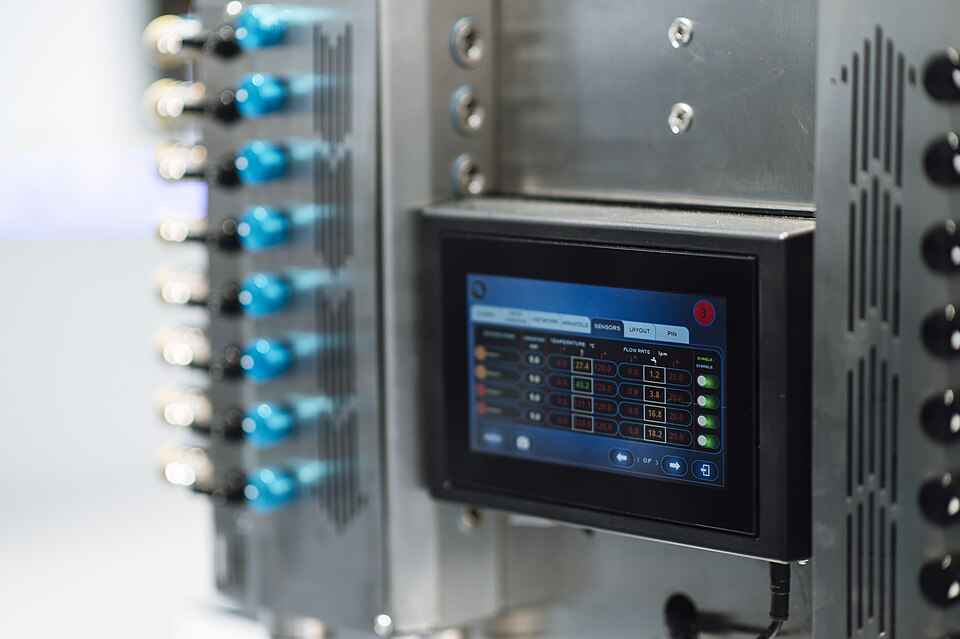
Featured photo: Shixart1985 / Nenad Stojković, via Wikimedia Commons, CC BY 2.0. Image resized for web use; no other editorial alteration.
Recent Comments