
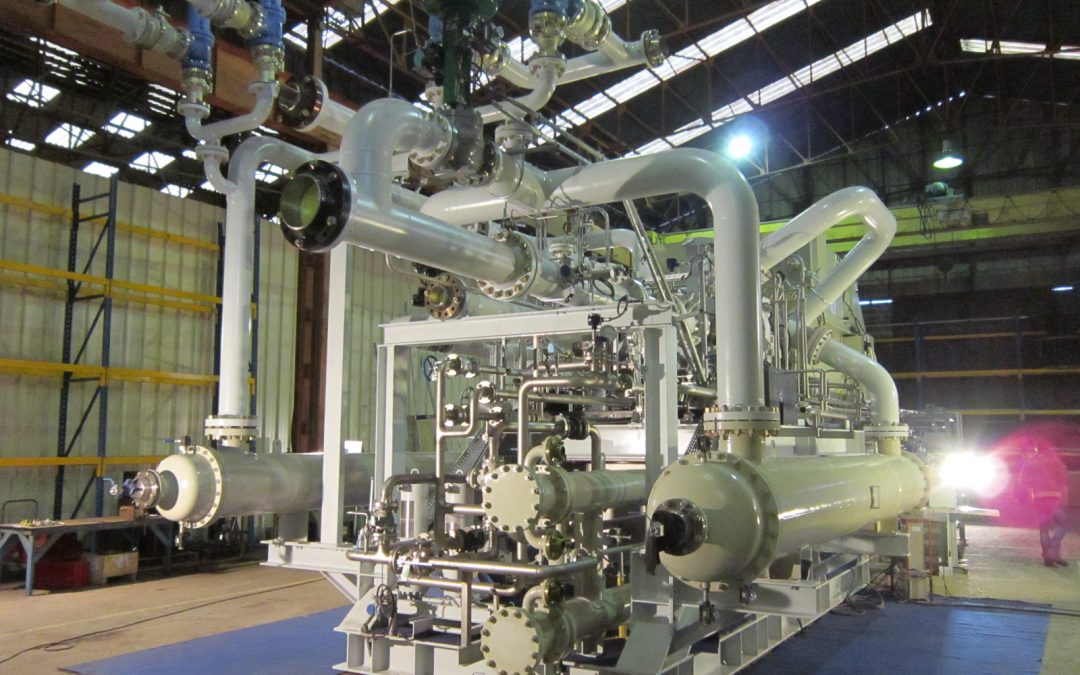
Compressed air is one of those utilities that can quietly waste a lot of energy. Plants often keep extra pressure in the system because it feels safer, then live with the energy cost for years. A 2026 study from a Malaysian semiconductor plant caught my attention: reducing centrifugal-compressor discharge pressure from 8.9 bar to 7.5 bar, guided by a digital twin, cut electricity use by 10.25% while maintaining the required production airflow.
I would not copy the 7.5 bar setting into another plant. Every compressed-air system is different. The useful part of the study is the method: measure the system properly, model it, test the pressure margin, make one controlled change at a time and verify what actually happens.
That makes compressed air particularly timely for manufacturers in Malaysia and Singapore, where energy policy, grant support and industrial digitalisation are increasingly converging around measurable efficiency improvements.
Why this topic matters now in Malaysia
Malaysia’s National Energy Efficiency Policy and Action Plan 2026-2035 (NEEAP 2.0), published in August 2026, explicitly identifies compressed air, steam, hot water and related industrial utilities as energy-efficiency opportunities. It also identifies digitalised production, industrial IoT, real-time monitoring, data analytics and control as mechanisms for continuous energy optimisation.
The plan targets an 11.6% reduction in national energy demand by 2035 against business-as-usual projections, with cumulative energy savings of 815,382 TJ. Within its industrial measures, energy-efficient utilities are expected to contribute materially, while digitalised production processes are expected to improve both energy efficiency and productivity.
This direction sits alongside Malaysia’s Energy Efficiency and Conservation Act framework. For large energy consumers, the practical requirement is moving beyond periodic meter reading towards a systematic energy-management process with baselines, reporting, audits and measurable energy-saving measures. CANS has discussed this wider shift in EECA 2024: Why Malaysian Plants Need Continuous Energy Intelligence.
The Energy Commission is also running a 2026 national energy survey covering manufacturing, commercial and domestic sectors, reinforcing the broader push for more granular and reliable energy-use data.
The Malaysian semiconductor study: what was actually demonstrated?
The 2026 paper, Digital Twin-Enabled Pressure Optimization for Energy, Cost, and Carbon Reduction in Centrifugal Compressors, used 20,577 operational records from a Malaysian semiconductor plant. The hybrid digital twin combined thermodynamic modelling, real operating data and predictive analytics.
The compressor discharge pressure was progressively reduced from 8.9 bar to 8.5 bar, 8.0 bar and finally 7.5 bar. Before each change, the proposed operating condition was evaluated against compressor and production constraints. At the final condition:
- electricity consumption fell by 10.25%;
- production airflow remained stable and sufficient;
- the digital twin achieved prediction error below 5% against measured operation; and
- the study reported an approximately 10% reduction in indirect CO2 emissions.
This is significant because it was not only a laboratory simulation. It was validated against full-scale industrial operating data.
Do not copy the 7.5 bar setting
The wrong conclusion would be: “reduce every factory to 7.5 bar”. Compressed-air systems differ substantially. Minimum safe pressure may be determined by the most remote machine, a high-demand process, valve and actuator requirements, filter and dryer pressure drop, intermittent peak loads, compressor control philosophy or process validation requirements.
A sound optimisation study therefore has to establish the minimum pressure actually required at the point of use, not simply lower the compressor setpoint. It must also check compressor surge margin, motor loading, sequencing behaviour, dryer performance, receiver capacity and pressure stability during transient demand.
The digital twin is useful because it lets the plant compare operating scenarios before implementing them, but the model is only as trustworthy as the instrumentation, assumptions and validation behind it.
What I would measure first
For most plants, the starting architecture is not complicated. It typically needs:
- compressor power: kW, current, power factor and energy;
- discharge and header pressure: including pressure at critical downstream points;
- flow: total system airflow and, where practical, major branch flows;
- compressor state: loaded, unloaded, modulating, stopped, alarmed and sequence position;
- temperature and ambient conditions: where they materially affect compressor performance;
- pressure drop: across dryers, filters and key distribution sections;
- air quality: dew point or other quality parameters when production requires them;
- production context: line status, shift, product mix and demand state so energy is interpreted against actual output.
Existing PLC, SCADA and historian data should be reused where reliable. Additional meters and sensors should be added only where they close a specific measurement gap. For older systems, a brownfield integration approach using OPC UA, Modbus, industrial gateways or edge middleware can collect the required data without replacing dependable control equipment. See OPC DA to OPC UA: Modernise Brownfield SCADA Data Without Replacing the Plant.
Where the savings normally come from
A compressed-air optimisation project should examine more than the compressor itself. The main opportunities usually sit across the complete utility system:
- Excess header pressure. Higher pressure increases compression work and can also increase artificial demand through unregulated uses and leaks.
- Poor compressor sequencing. Multiple compressors may operate inefficiently when control bands overlap or machines spend excessive time unloaded.
- Leakage. Continuous flow outside productive periods is often a direct indicator of avoidable loss.
- Distribution pressure drop. Undersized piping, blocked filters, dryers or poorly configured networks may force the compressor room to operate at unnecessarily high pressure.
- Demand spikes. Short-duration peaks may be better handled with storage, local receivers or process changes than by raising the entire plant pressure.
- Maintenance condition. Fouling, cooling problems, filter restriction, valve issues and degraded compressor condition can shift the operating efficiency away from its expected curve.
This last point links energy optimisation directly to condition monitoring and predictive maintenance. A digital twin should not only search for a lower energy setpoint; it should also detect when the real machine begins to deviate from its expected performance.
Singapore manufacturers have a parallel investment signal
Singapore’s Energy Efficiency Grant (EEG) has been extended through 31 March 2027. Manufacturing companies are eligible, and Enterprise Singapore specifically lists compressed-air systems among equipment categories that can be submitted for support under the manufacturing sector, subject to the applicable technical requirements.
The EEG Base tier supports pre-approved energy-efficient equipment up to the scheme limits. The EEG Advanced tier, available to manufacturing and construction, can support larger energy-efficiency investments and has a higher combined support cap, subject to demonstrated carbon-abatement and eligibility requirements.
This does not mean a customised digital twin or every compressor project automatically qualifies. Grant scope, equipment eligibility, timing and procurement rules still have to be checked before committing the purchase. What the scheme does tell us is that compressed air is now firmly inside the energy-efficiency investment conversation.
A practical implementation sequence
For a Malaysian or Singapore factory, a defensible compressed-air digitalisation project can be structured in six stages:
- Establish the baseline. Record pressure, flow, kW, production state and compressor loading over representative operating periods.
- Map the system. Identify compressors, dryers, receivers, filters, major branches, critical consumers and known pressure-drop points.
- Build and validate the model. Combine compressor performance characteristics with measured plant data. Validate predicted pressure, flow and power against real operation.
- Rank the losses. Separate pressure-margin losses, leakage, sequencing inefficiency, pressure drop and equipment-condition losses.
- Test controlled changes. Simulate first, then implement changes incrementally with minimum-pressure and production constraints enforced.
- Close the loop with measurement and verification. Track kWh, specific energy consumption, pressure stability, production output and equipment condition after each change.
For plants that want the digital model tied into wider production and asset context, CansNEXUS Digital Twin & Industrial AI Platform provides a framework for integrating real-time industrial data, analytics and digital-twin views rather than treating energy optimisation as an isolated spreadsheet exercise.
Do not judge it by monthly kWh
A compressor-room project can appear successful simply because production fell. The more meaningful KPI is normally specific energy consumption: for example, kWh per Nm3 of delivered air, adjusted where necessary for pressure, production condition and ambient factors.
The same principle applies at plant level. Energy dashboards should relate consumption to production, machine state and operating conditions. This is what makes the result auditable and allows management to distinguish a genuine efficiency improvement from a change in output.
Discuss compressed-air energy optimisation with CANS
CANS can assess an existing compressed-air or industrial-utility system and define a staged architecture covering instrumentation, PLC/SCADA integration, edge data collection, energy monitoring, condition monitoring, digital twins, industrial AI and measurement & verification.
Send CANS an enquiry or contact CANS on WhatsApp.
References
- Applied Research (2026) — Digital Twin-Enabled Pressure Optimization for Energy, Cost, and Carbon Reduction in Centrifugal Compressors
- Energy Commission Malaysia — National Energy Efficiency Policy and Action Plan 2026-2035
- Energy Commission Malaysia — 2026 Energy Survey for Manufacturing, Commercial and Domestic Sectors
- Enterprise Singapore — Energy Efficiency Grant
- Enterprise Singapore — Energy Efficiency Grant FAQ
- National Environment Agency Singapore — Energy Efficiency Grant
- Wikimedia Commons — Centrifugal compressor on skid, DWI, CC BY-SA 3.0
Recent Comments